For owners, operators & asset managers
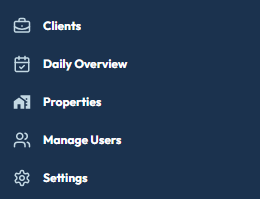
automate your asset management
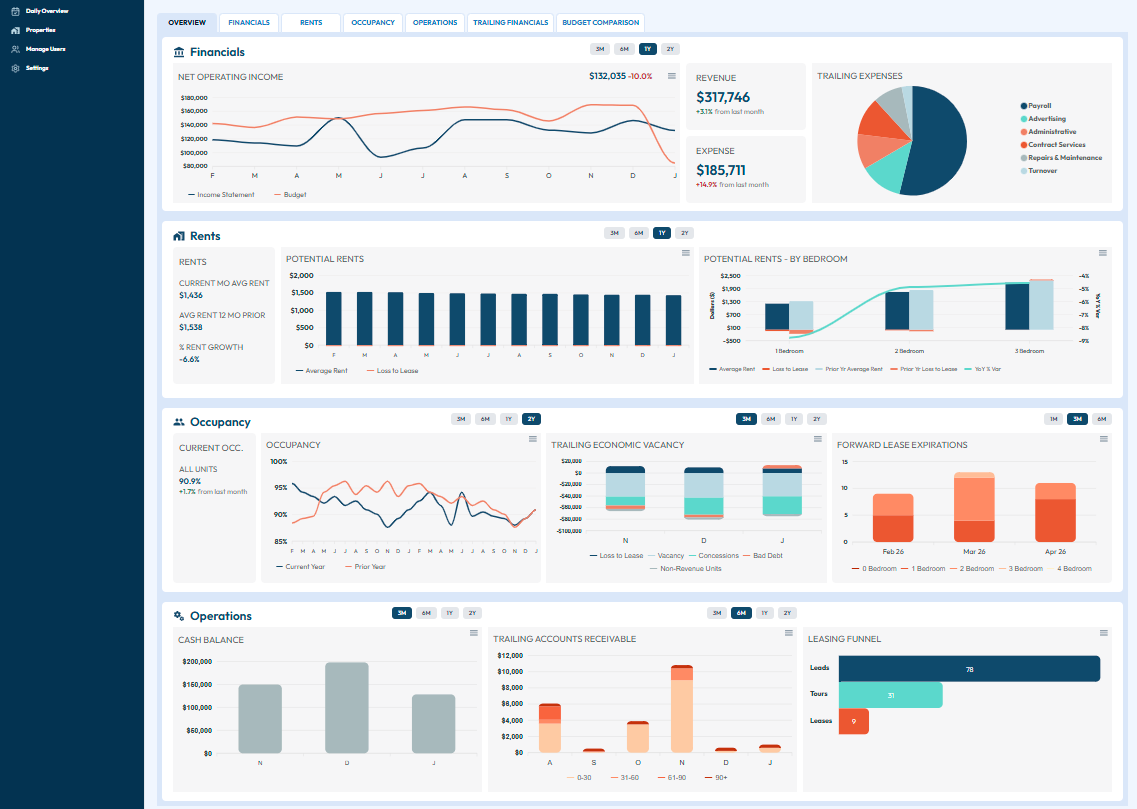
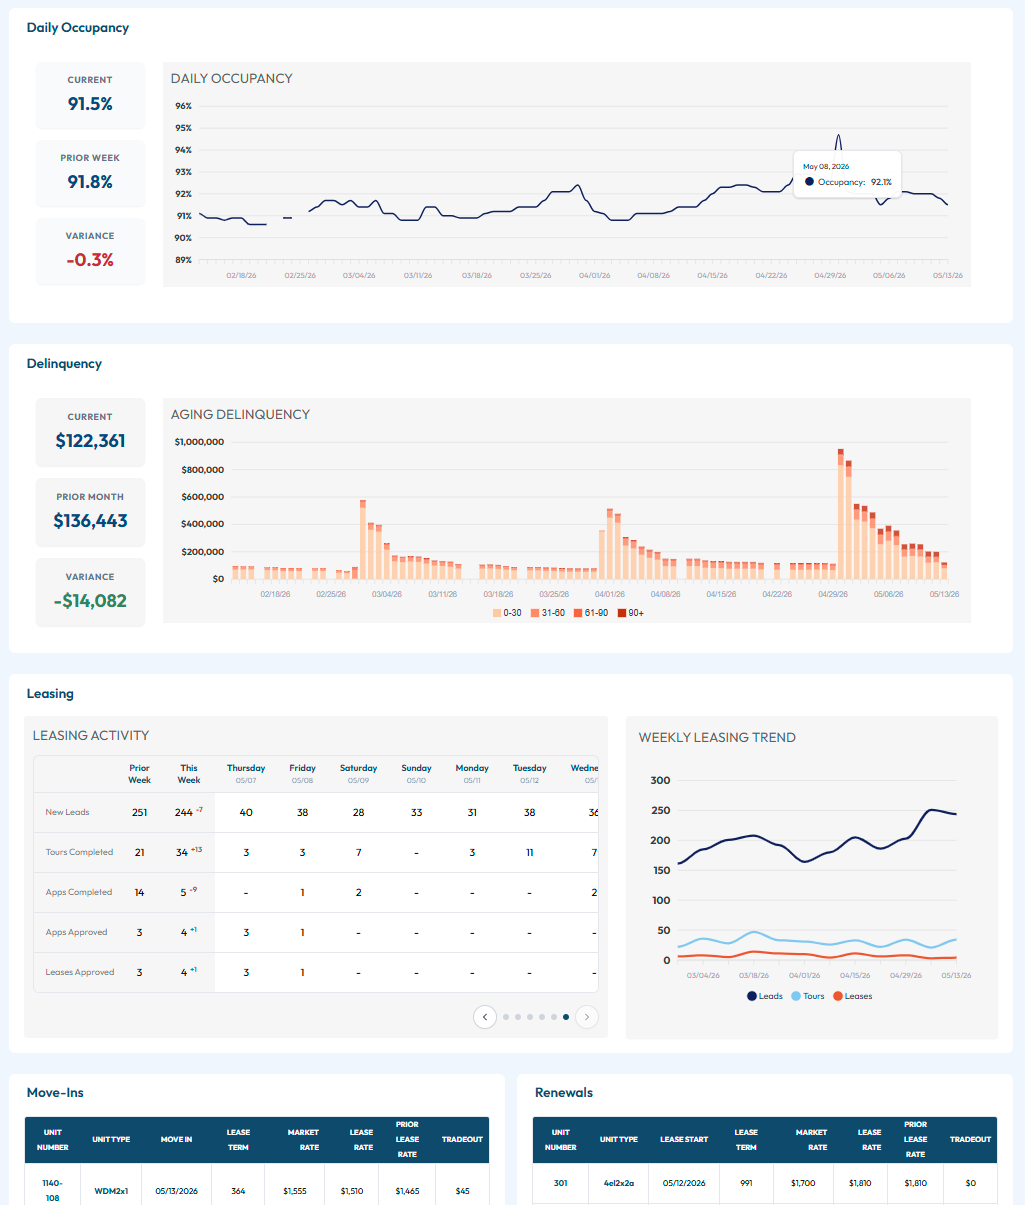
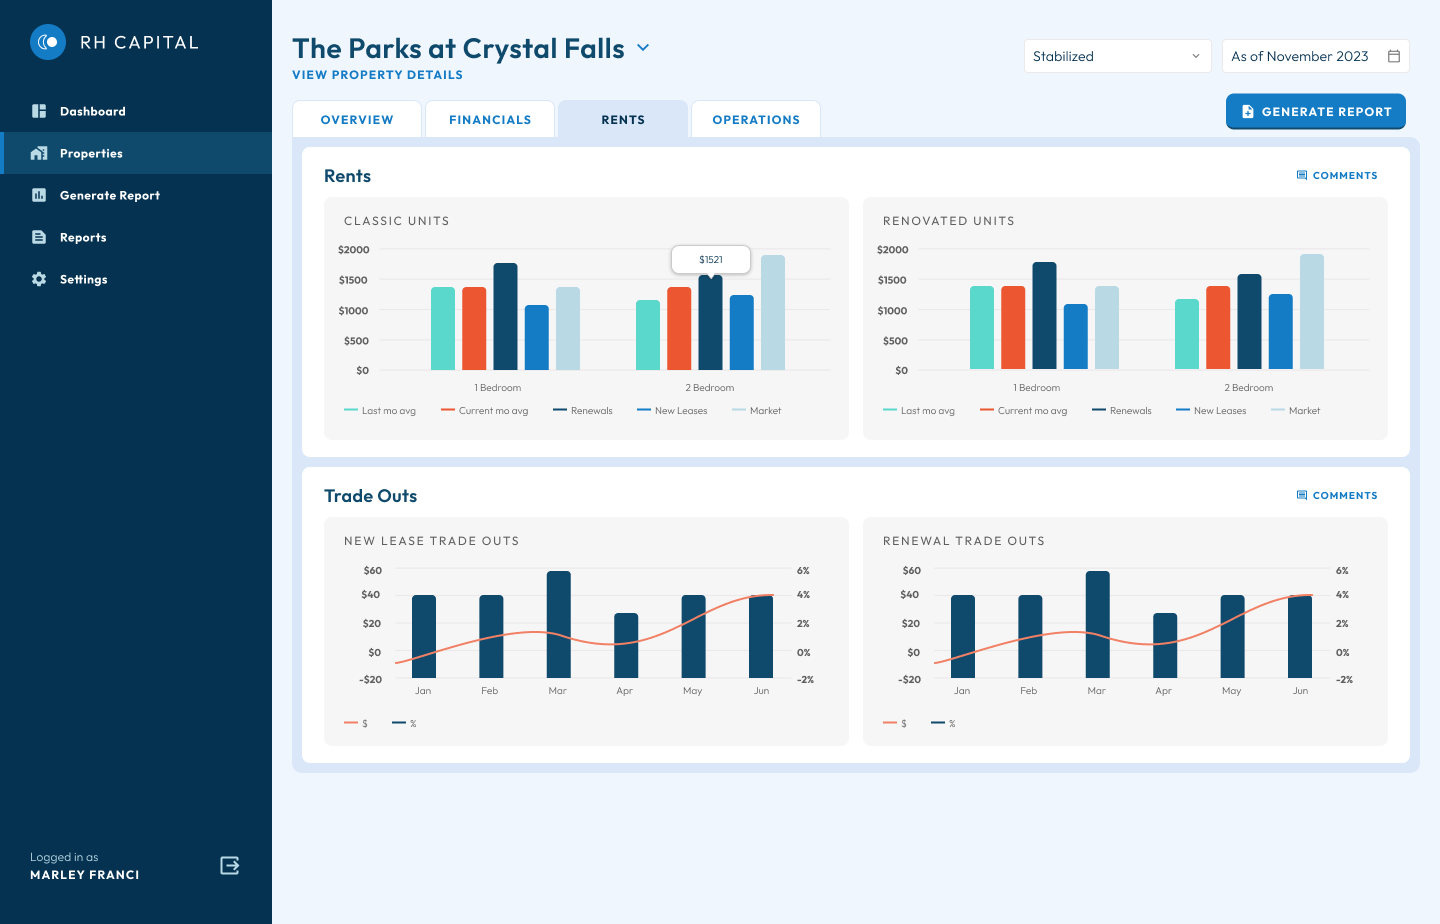
Ember turns raw property data into a living, unified picture of your portfolio. No more sifting through PDFs. No more manually updating spreadsheets.
ember
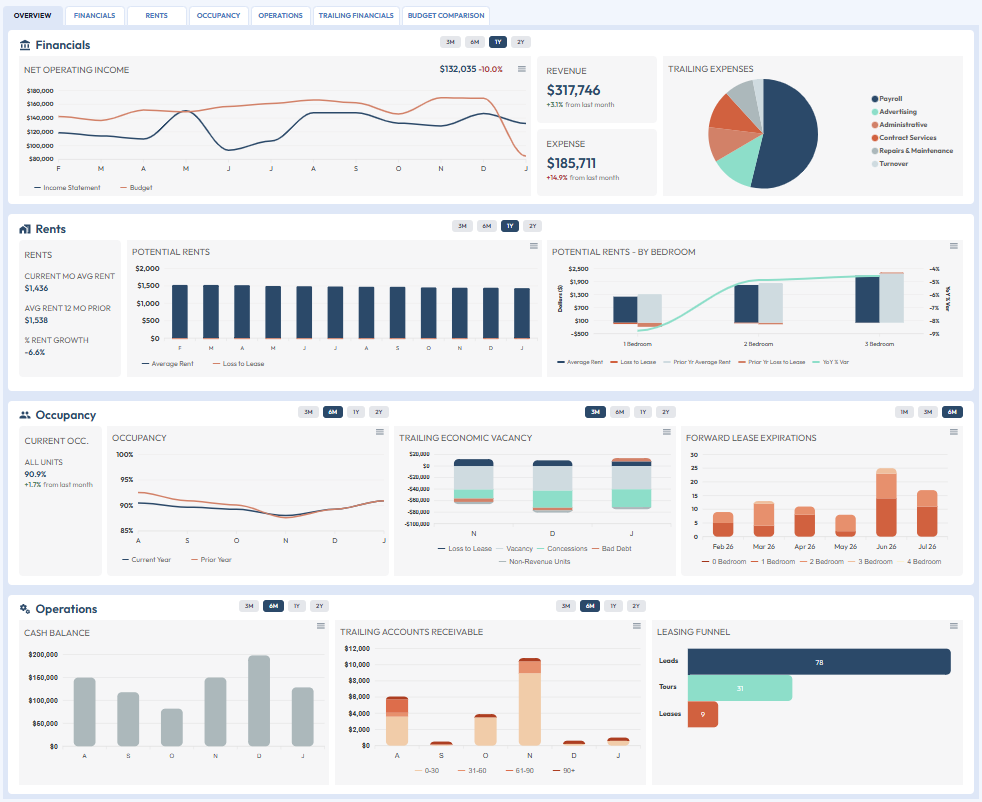
Expenses
-5.2% vs prior period
Portfolio NOI
$1,988,376
+9.3% this period
Compatible with leading PMS platforms